ROA, ROE, and What These Key Measures Mean for YOUR Bank
 Last week I wrote about increasing bank profitability in an era of reduced regulatory scrutiny. I also pointed out how some banks have grown their net income quite impressively over the last five-year period.
But while net income is a clear number that tells you how much profit a bank generates, there are other key measures to watch. If you’re looking to invest in a bank stock, or trust a bank with your hard-earned deposits, it helps to know what they are and how they work!
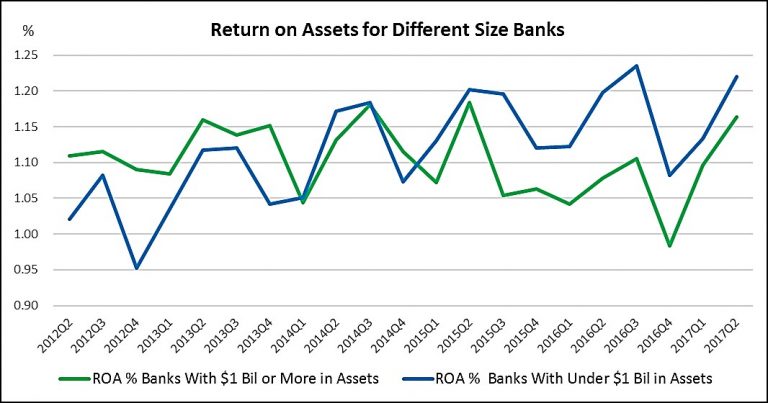
The first key measure is the Return on Assets ratio, also known as ROA. It’s the most commonly used benchmark for bank profitability since it measures the company’s return on investment in a format that is easily comparable with other institutions. ROA is a ratio of net income produced by total assets during a period of time. In other words, it measures how efficiently a company can manage its assets to produce profits.
Historically speaking, a ratio of 1% or greater has been considered pretty good. But this ratio will fluctuate with the prevailing economic times. Larger banks also tend to have a lower ratio.
Take a look at the graph below. The green line represents ROA for banks with $1 billion or more in total assets, while the blue line is for banks with assets of less than $1 billion. As you can see, ROA at smaller banks surpassed the big banks at the end of 2014, and the trend has continued since then.
That’s likely because the recovery from the Great Recession was in full swing and things were returning to normal for the banking industry and the overall economy. Currently, the big banks’ average ROA is at 1.16%, compared to 1.22% for banks with less than $1 billion in total assets.
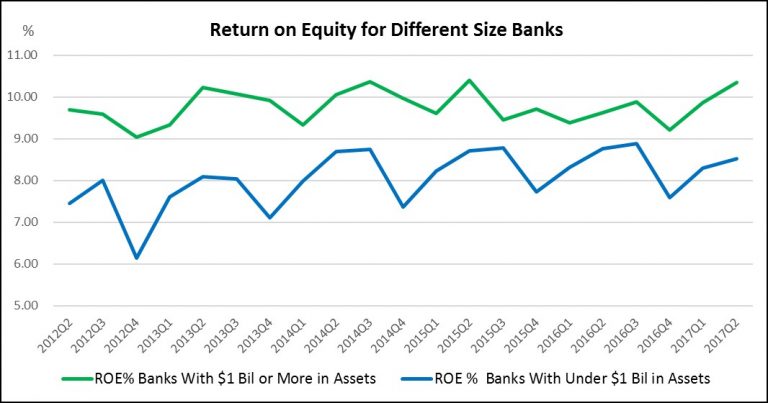
Another ratio worth looking at is Return on Equity, or ROE. This ratio is commonly used by a company’s shareholders as a measure of their return on investment. It measures the amount of a company’s income that’s returned as shareholder equity.
The U.S. banking industry’s average ROE in Q2 2017 was 8.75%. Unlike ROA, ROE is clearly higher at the bigger banks. It averaged 10.34% in Q2 2017 at large institutions, but only 8.51% at smaller institutions.
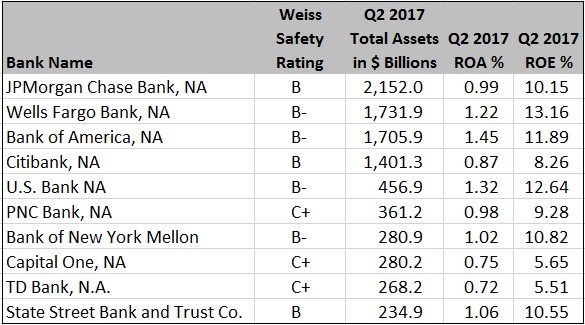
How do the biggest, most well-known banks look when it comes to ROA and ROE? To find out, I compiled a list of the ten largest banks by assets along with their ratios.
ROA at most banks on the list fell below the industry average of 1.21%. Only three of them topped it. But the big guys fared better when it came to ROE, with seven banks beating the 8.75% industry average.
ROA and ROE of the 10 Largest U.S. Banks
The bottom line is that you can analyze bank profitability and performance in a few different ways — and there are different expectations for different-sized banks. Smaller banks tend to focus on the local market, and can provide stability and limit risk. Bigger ones tend to take on more risks in different areas, and can potentially bring in a lot of cash. But when they fall, they can fall hard – and it can have wider market implications.
Regardless, if you’re looking to invest in a bank, or trust it with your hard-earned money, make sure you investigate it on the Weiss Ratings website. Each and every one of them has the ROA and ROE ratios listed on their Summary pages.
Think Safety,
Remi Lukosiunas
|
Remi Lukosiunas, a Financial Analyst, joined Weiss Ratings in 2014 with a financial services background in internal audit and the credit union industry. Remi conducts banking, credit union, insurance and investment research. He has also written extensively on stocks and investing using ratings as a guide. Remi is a graduate of Florida State University with a degree in multinational business. |
 Money and Banking Edition, By Remi Lukosiunas, Financial Analyst